A Deep Dive into Import Concentration and Supply Chain Dependence
Introduction
Egypt’s Renga market is not only shaped by local consumption habits—but also by where the product comes from. Understanding the country-of-origin structure is critical to assessing supply risk, pricing dynamics, and long-term sustainability.
Using 2024 data, OWL Research analyzed the top exporting countries of Renga to Egypt—revealing a highly concentrated supply landscape.
Key Findings at a Glance
- Norway dominates the market with 50% share
- The Netherlands follows with 29%
- The UK and other sources remain relatively small players
- Egypt’s supply is heavily concentrated in Europe
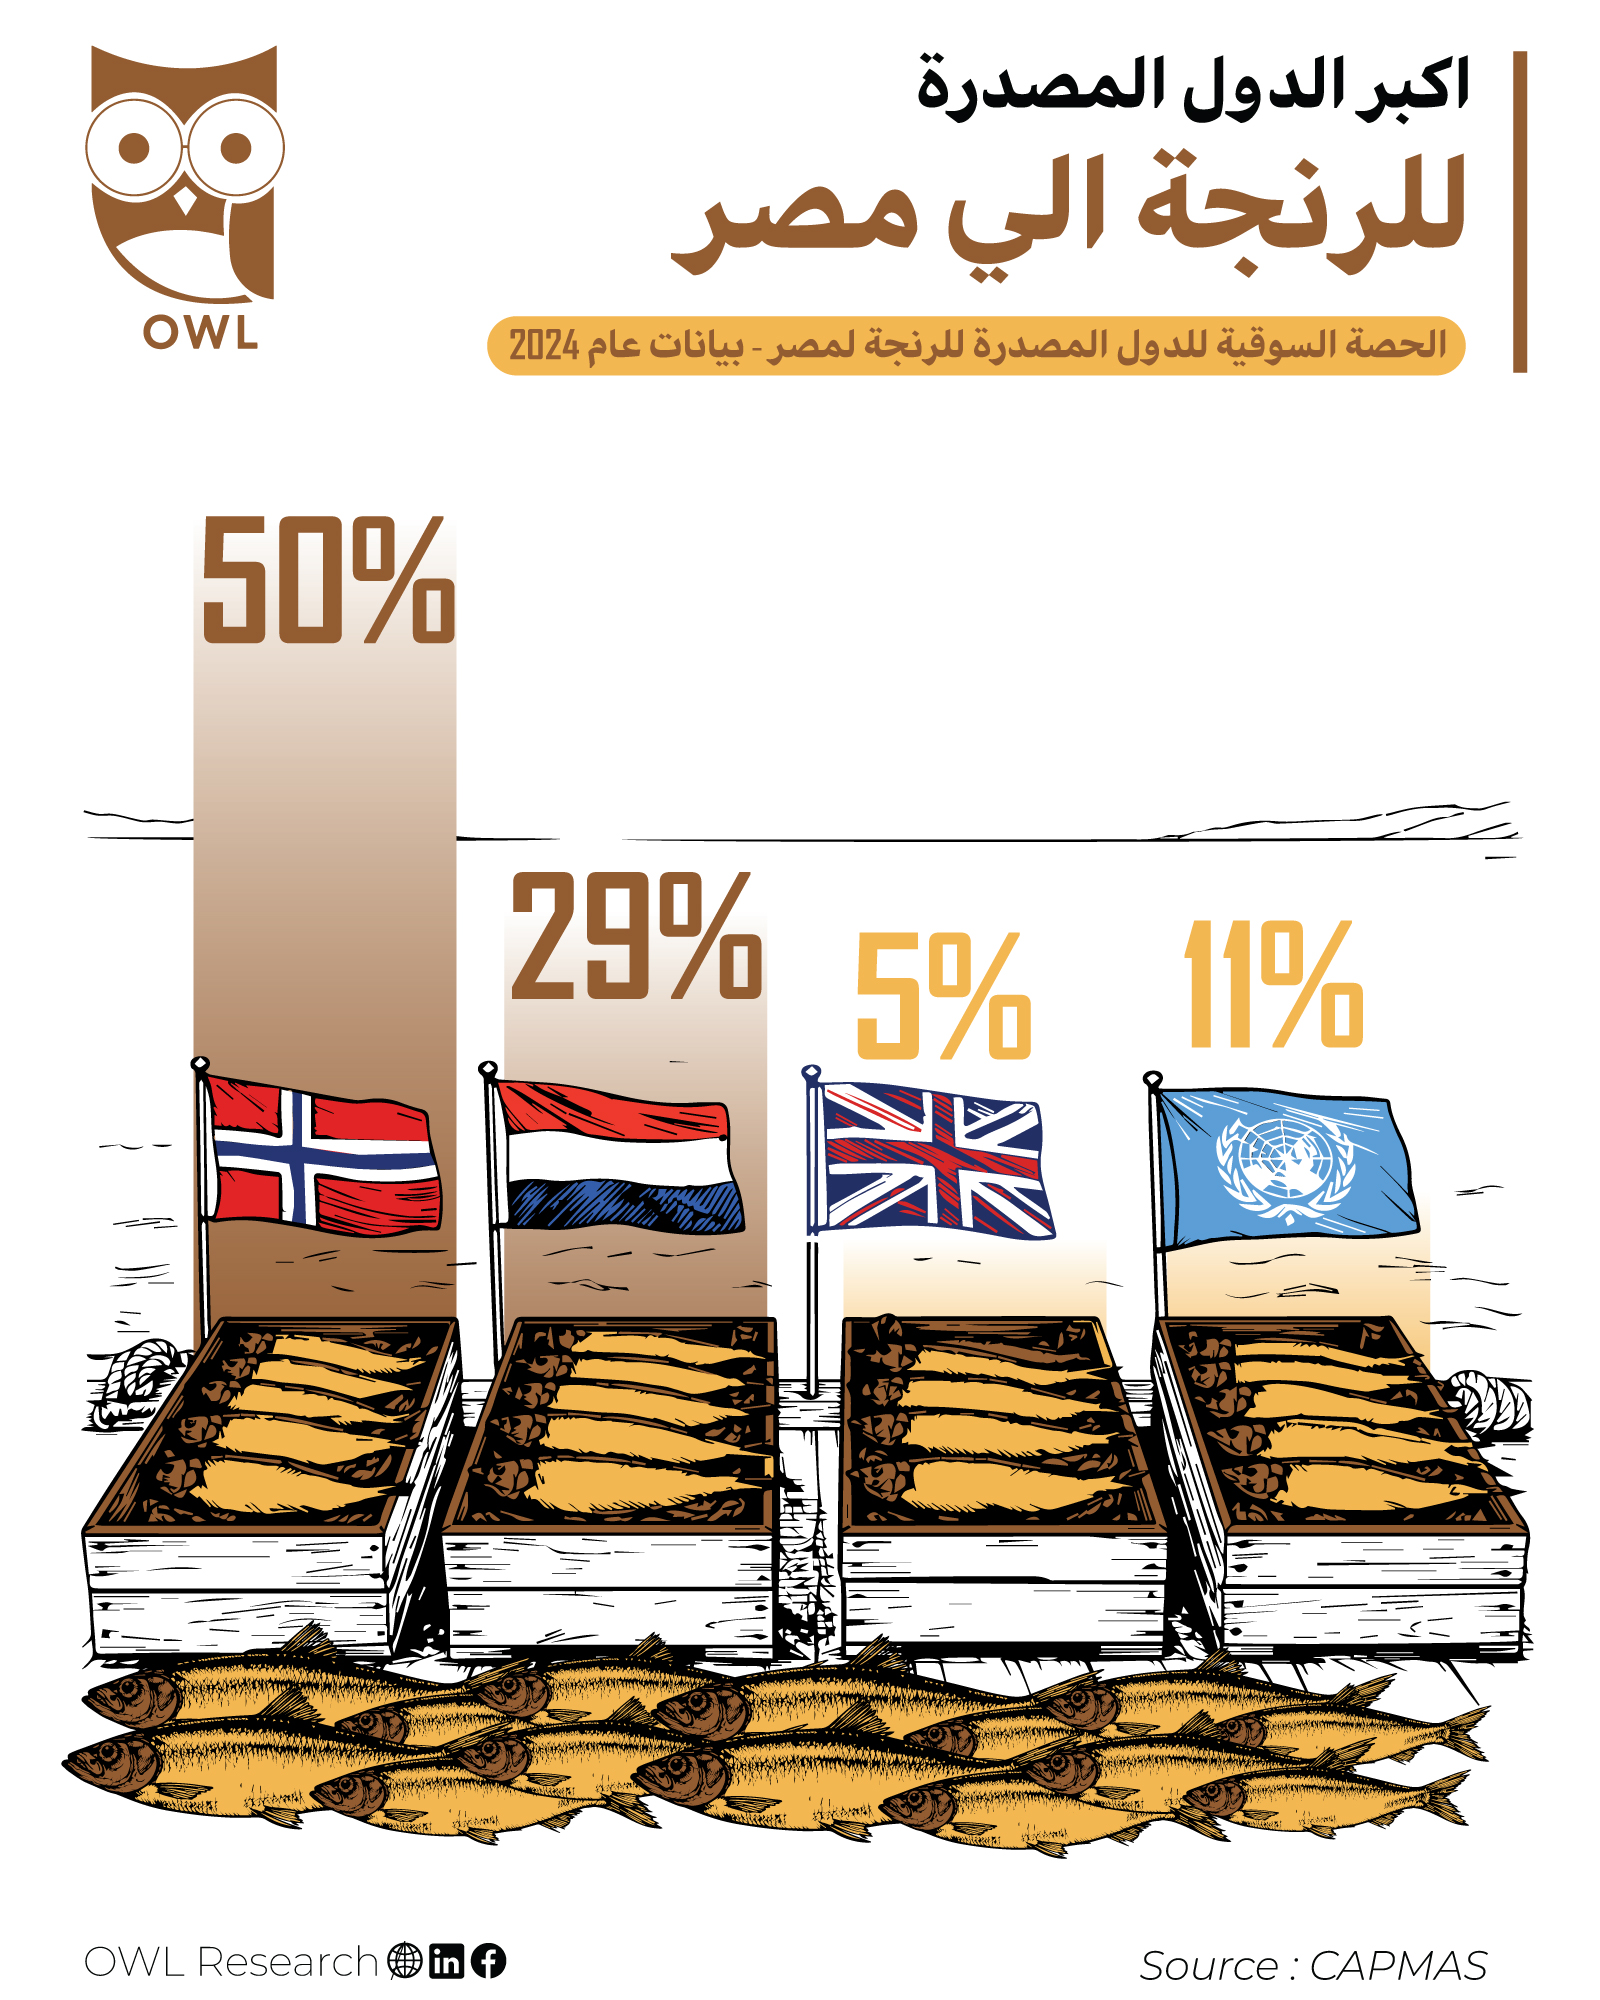
Market Share Breakdown (2024)
- Norway: 50%
- Netherlands: 29%
- United Kingdom: 5%
- Other countries: 11%
1. Norway: The Market Leader
With half of Egypt’s Renga imports, Norway is the primary backbone of supply.
Why Norway?
- Global leader in high-quality fish exports
- Strong expertise in cold-chain logistics
- Consistent product standards and reliability
👉 Insight:
Egypt’s reliance on Norway creates efficiency and quality stability, but also introduces high dependency risk.
2. Netherlands: The Strategic Secondary Supplier
Holding nearly one-third of imports, the Netherlands plays a critical supporting role.
Key strengths:
- Advanced seafood processing and re-export hub
- Strong trade infrastructure within Europe
- Flexibility in sourcing and redistribution
👉 Insight:
The Netherlands acts as both a supplier and a trade gateway, enhancing supply flexibility.
3. United Kingdom & Others: Niche but Important
With a combined ~16% share, the UK and other countries provide:
- Diversification of supply sources
- Backup options during supply disruptions
- Potential for price competition
👉 Insight:
While small, these players are strategically important for risk mitigation.
Strategic Implications
1. High Supply Concentration Risk
With ~80% of imports coming from just two countries, Egypt faces:
- Exposure to geopolitical shifts
- Vulnerability to trade restrictions
- Sensitivity to currency fluctuations (EUR/NOK)
2. Limited Supplier Diversification
The current structure suggests:
- Low penetration from non-European markets
- Untapped opportunities in alternative sourcing regions
👉 Opportunity:
Exploring new suppliers could reduce dependency and improve negotiation power.
3. Pricing Power Lies with Suppliers
Given the concentration:
- Exporting countries hold strong influence on pricing
- Importers may face margin pressure during supply shocks
Conclusion
Egypt’s Renga supply chain is:
- Highly efficient—but highly concentrated
- Dominated by European exporters
- Structurally exposed to external risks
For stakeholders, the priority is clear:
Diversify supply while maintaining quality standards