The global economic landscape is increasingly shaped by two major groupings: the G7 and BRICS. While both bring together countries with significant economic and geopolitical influence, their economic structures and individual contributions differ considerably.
According to IMF data, the economies represented in the comparison highlight the scale of economic resources concentrated within each group.
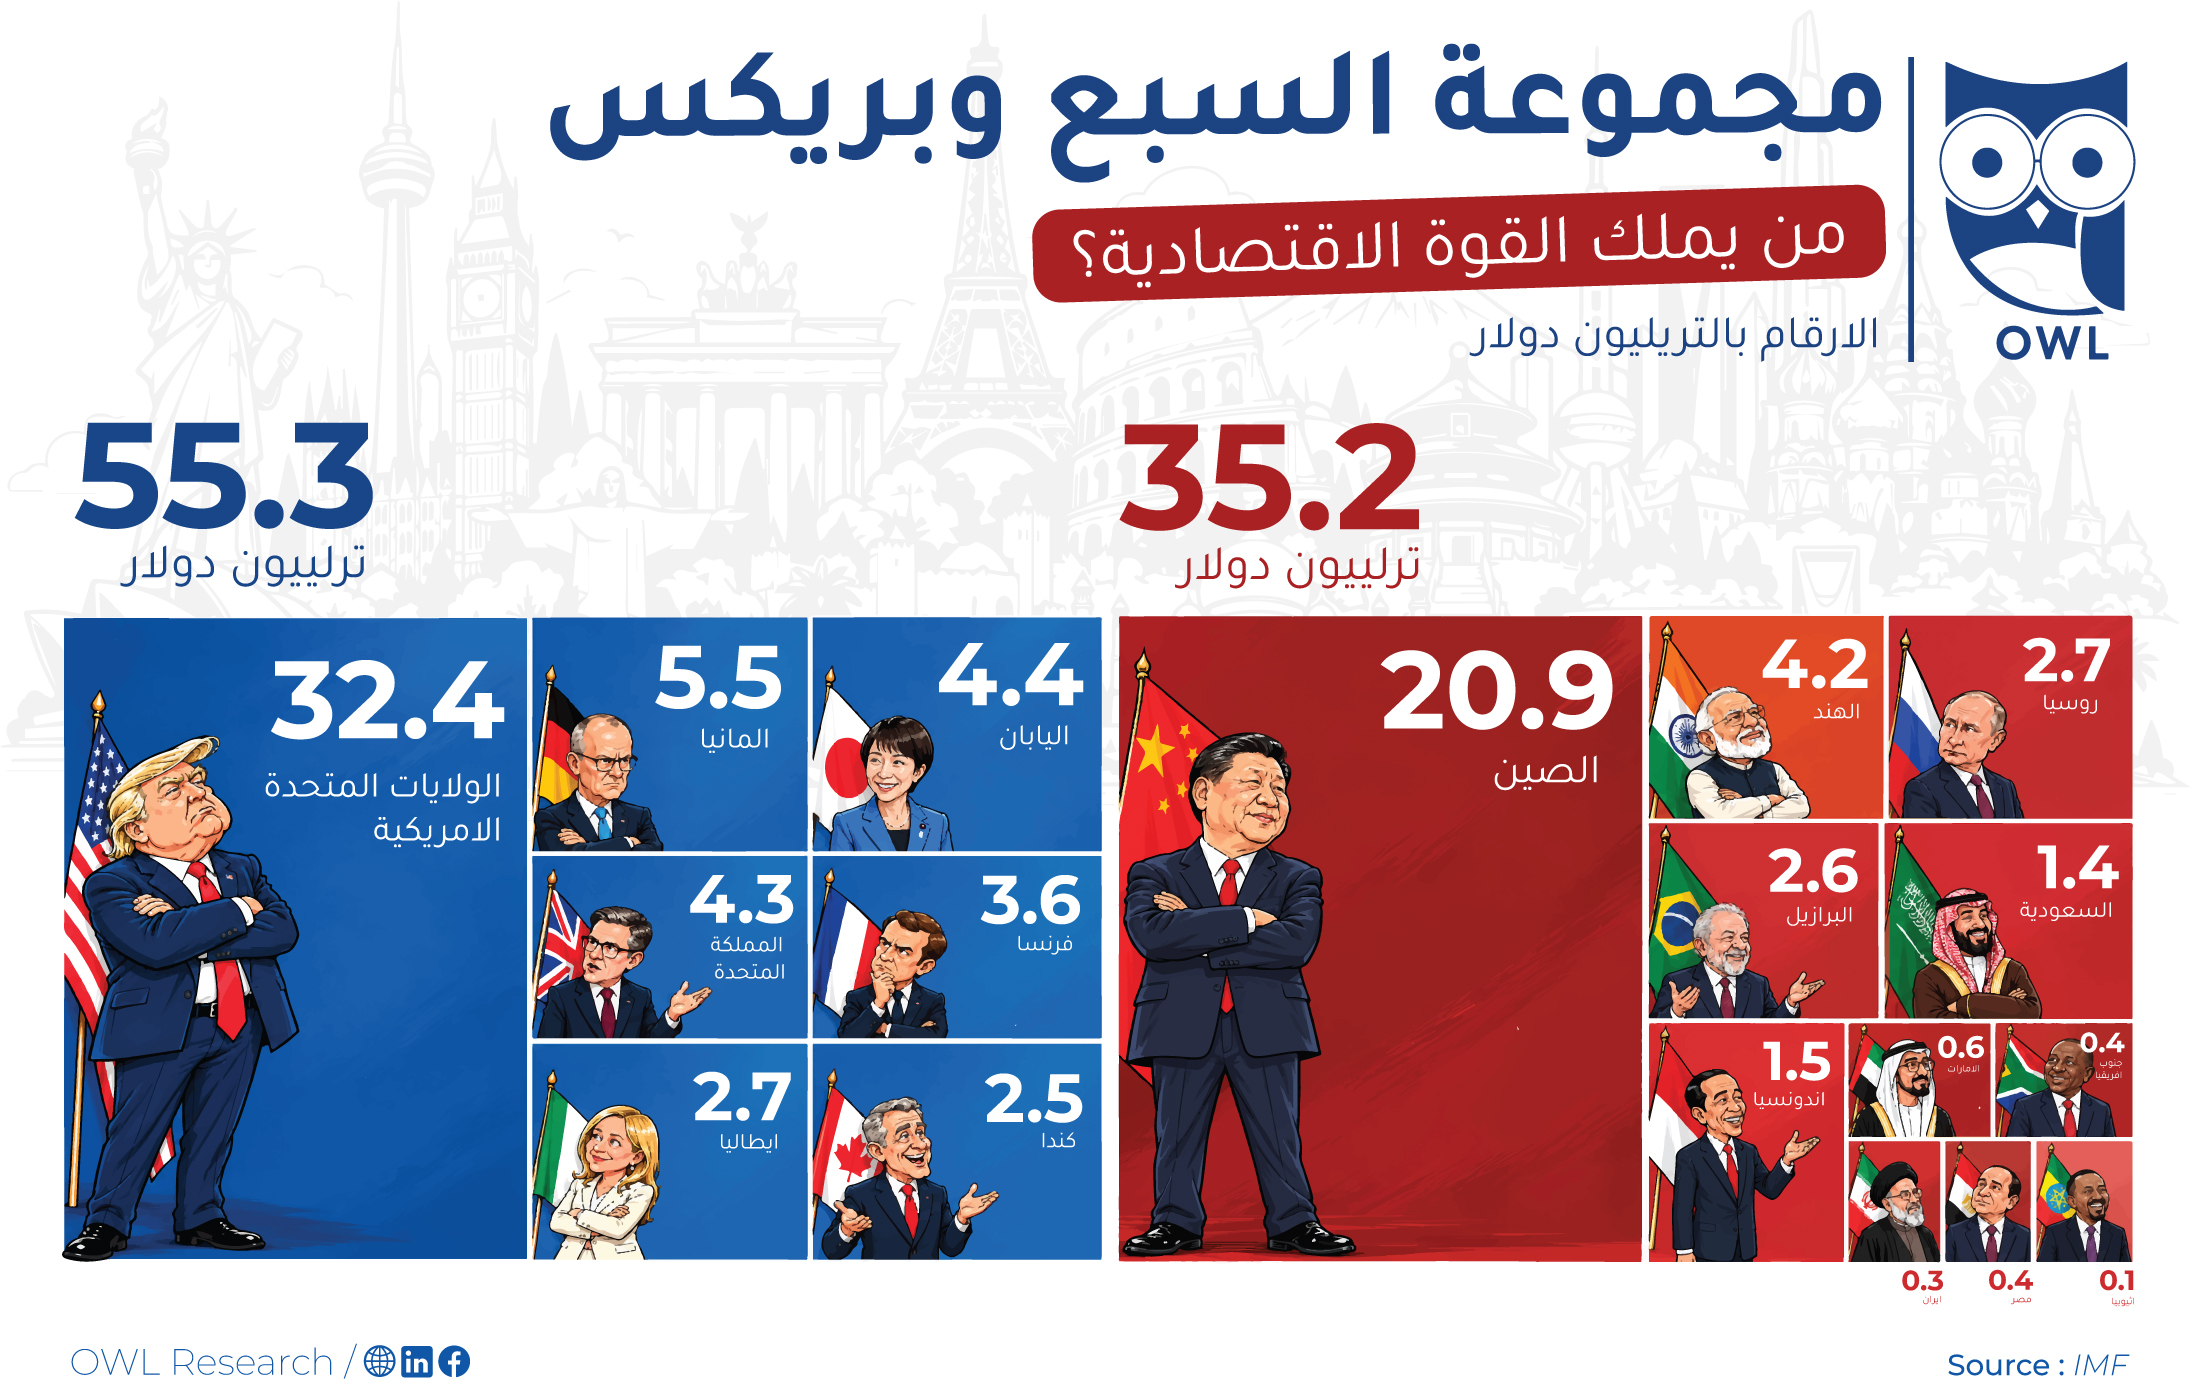
The G7’s Economic Scale
The G7 countries shown in the infographic represent a combined economic value of approximately USD 55.3 trillion.
The United States accounts for the largest share at USD 32.4 trillion, making it by far the largest economy within the group.
Other G7 economies include:
- Germany: USD 5.5 trillion
- Japan: USD 4.4 trillion
- United Kingdom: USD 4.3 trillion
- France: USD 3.6 trillion
- Italy: USD 2.7 trillion
- Canada: USD 2.5 trillion
The figures illustrate the concentration of economic output within the G7, particularly the substantial contribution of the United States.
BRICS Economic Composition
The BRICS economies shown in the infographic collectively account for approximately USD 35.2 trillion.
Within this group, China represents the largest economy at USD 20.9 trillion.
The remaining economies shown include:
- India: USD 4.2 trillion
- Russia: USD 2.7 trillion
- Brazil: USD 2.6 trillion
- Saudi Arabia: USD 1.4 trillion
- Indonesia: USD 1.5 trillion
- United Arab Emirates: USD 0.6 trillion
- South Africa: USD 0.4 trillion
- Egypt: USD 0.4 trillion
- Iran: USD 0.3 trillion
- Ethiopia: USD 0.1 trillion
The composition demonstrates the economic diversity of the BRICS grouping, combining major emerging economies with smaller economies whose economic weight is more limited within the overall group.
The Role of the Largest Economies
A key feature of both groups is the concentration of economic value among their largest members.
Within the G7, the United States contributes USD 32.4 trillion of the group’s USD 55.3 trillion total.
Within BRICS, China contributes USD 20.9 trillion of the USD 35.2 trillion shown.
This means that the economic profile of both groups is heavily influenced by their largest individual economies.
G7 and BRICS in Perspective
Based on the figures presented, the combined economic value of the G7 countries shown is approximately USD 55.3 trillion, compared with USD 35.2 trillion for the BRICS economies shown.
However, comparing the two groups requires some caution.
GDP size is only one measure of economic influence. Other indicators can produce different perspectives, including population, GDP per capita, trade flows, purchasing power parity, natural resources, investment, financial markets and growth rates.
The composition of BRICS has also evolved, meaning that comparisons depend on the specific membership and year being analyzed.
Why the Comparison Matters
The G7 and BRICS represent different economic groupings with distinct geographic and economic characteristics.
The G7 consists primarily of advanced economies, while BRICS brings together major emerging economies alongside other developing markets.
For businesses and investors, understanding the relative scale of these economies can provide useful context for assessing:
- Global demand
- Trade opportunities
- Investment markets
- Commodity consumption
- Emerging-market growth
- International economic relationships
Rather than looking only at the combined headline figure, examining the individual contribution of each member provides a clearer picture of where economic weight is concentrated.
Key Takeaway
The economies represented in the infographic total approximately USD 55.3 trillion for the G7 and USD 35.2 trillion for BRICS, according to the cited IMF data.
The comparison also highlights the concentration of economic weight around the United States within the G7 and China within BRICS, while the broader groups represent substantially different economic structures and market profiles.