How Is Global GDP Distributed Across the World’s Major Economic Sectors?
Economic strength is no longer measured solely by how much a country produces. It is increasingly determined by its ability to build a diversified economic structure that combines industrial production, services, and agriculture.
While some economies rely heavily on services as their primary engine of growth, others maintain a strong industrial foundation. Meanwhile, agriculture continues to play a significant role in the economic structure of several emerging markets.
A comparison of the United States, China, the European Union, and India reveals four distinct economic models, each reflecting different development priorities, productive capabilities, and sources of economic value.
United States: An Economy Driven by Services
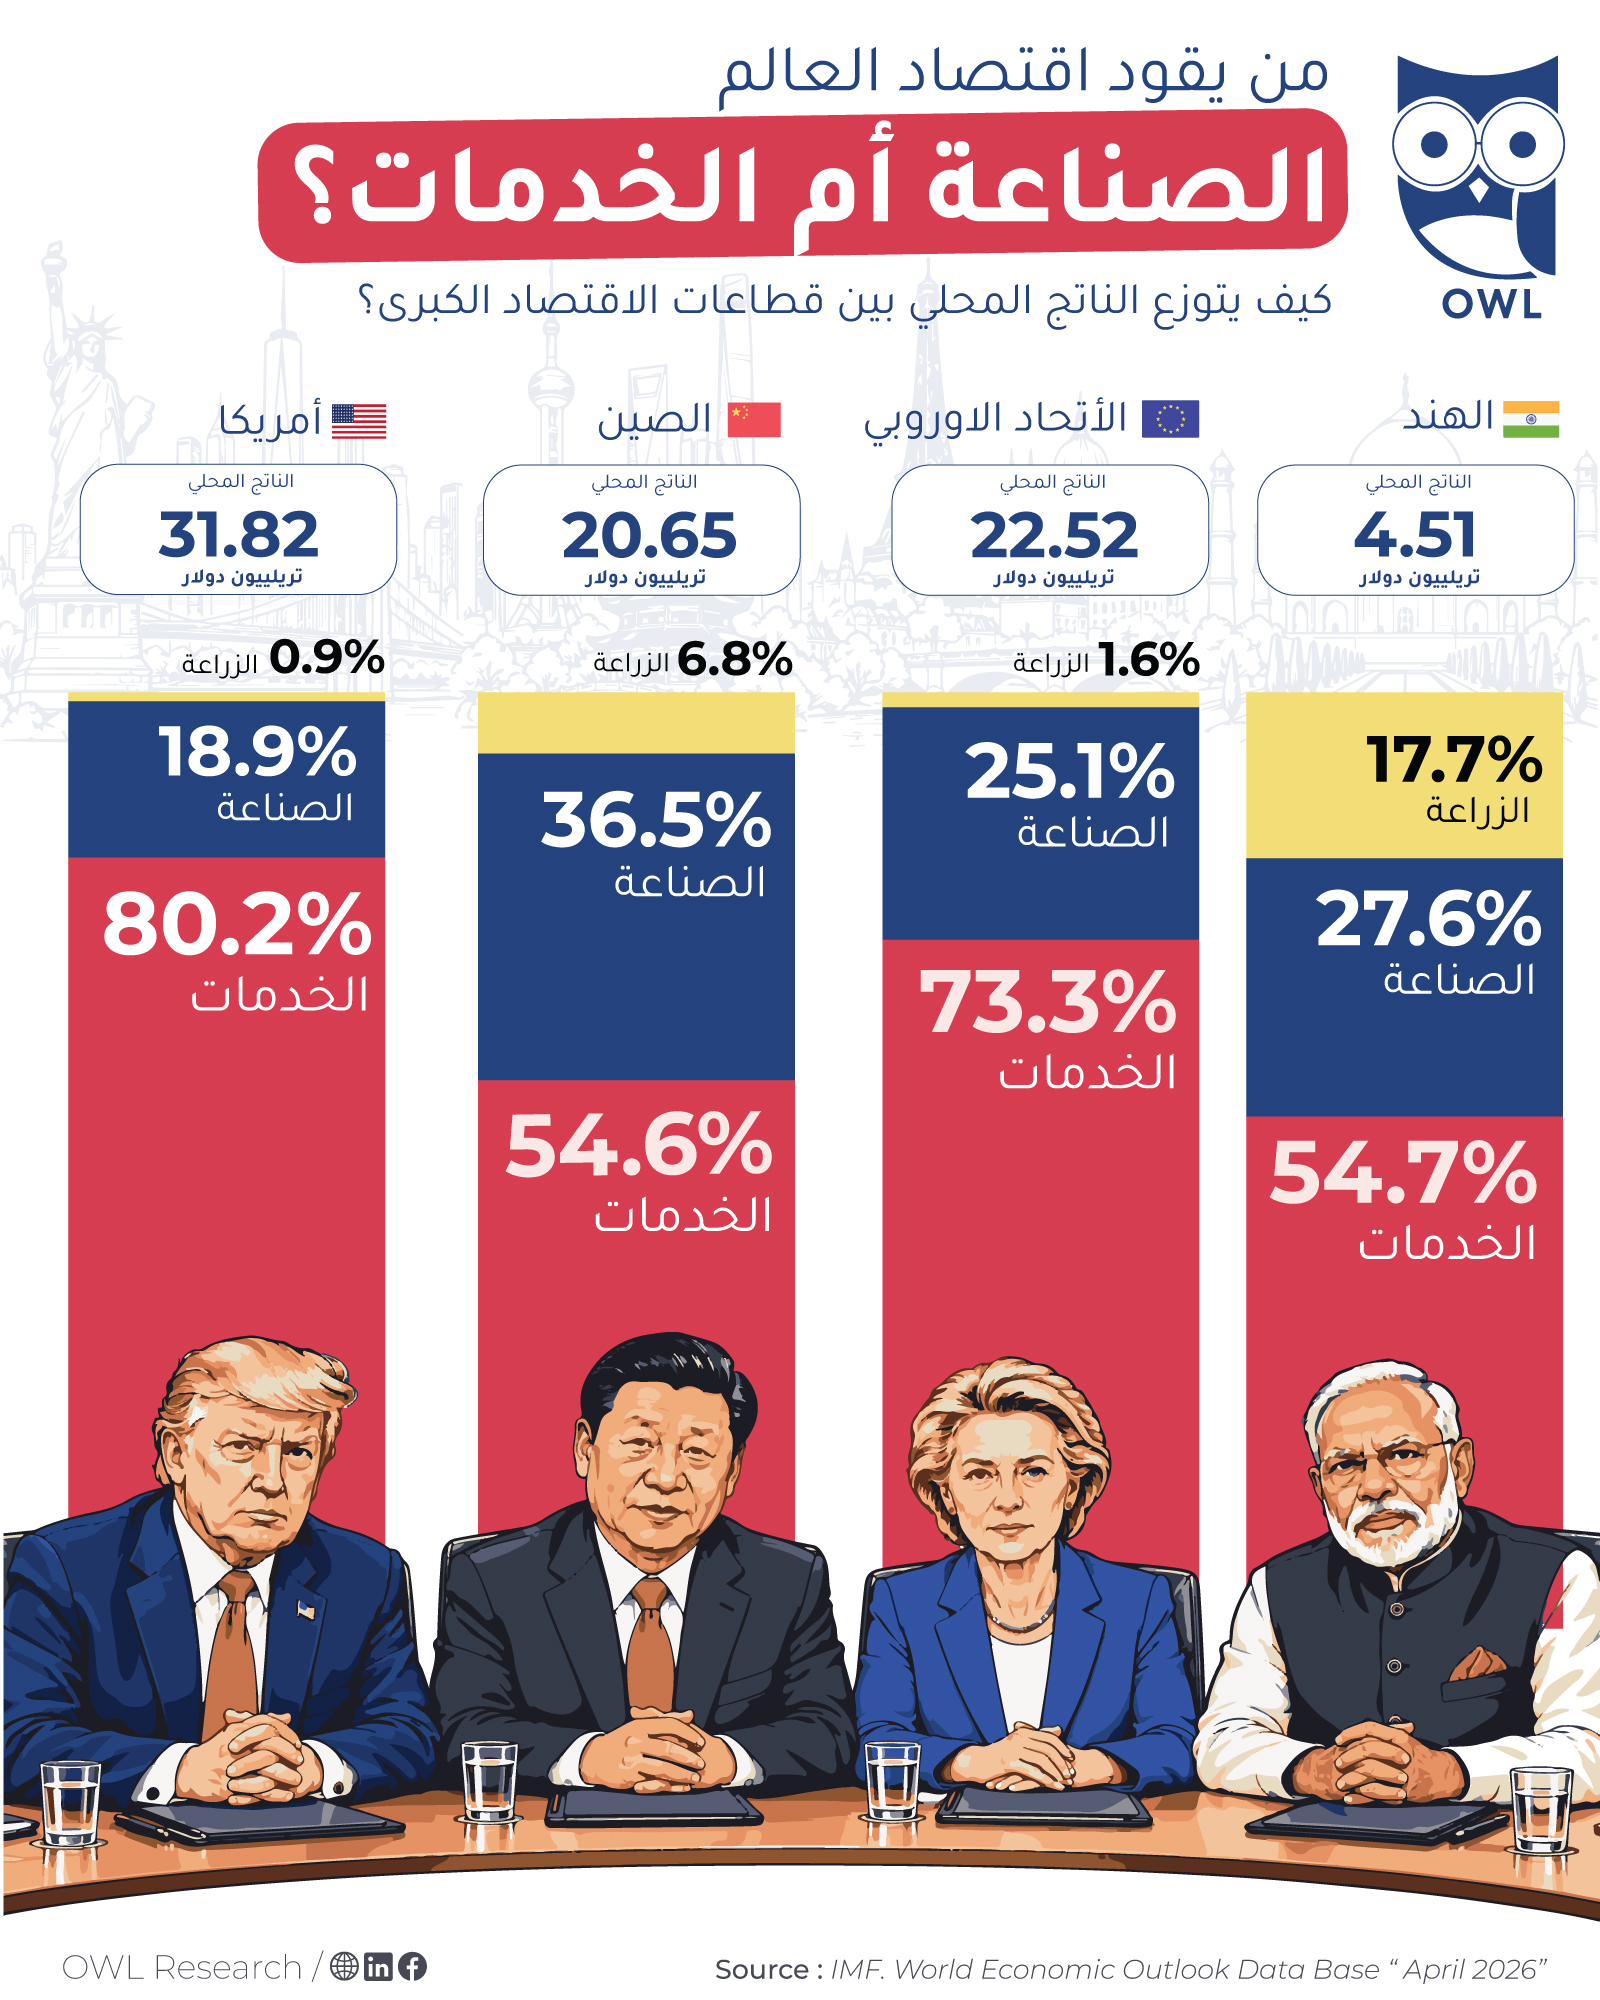
With an estimated GDP of $31.82 trillion, the United States represents the largest economy among the four.
Services account for 80.2% of its GDP, compared with 18.9% for industry and just 0.9% for agriculture.
This distribution reflects the structure of a highly developed economy, where financial services, technology, healthcare, retail, and professional services play a central role in generating economic value.
However, the relatively small share of agriculture and industry does not indicate that these sectors are insignificant. Rather, it highlights the dominant contribution of the services sector to the overall economy.
China: Industry at the Core of Economic Power
China presents a different economic model, with an estimated GDP of $20.65 trillion.
Industry contributes 36.5% of GDP, while services account for 54.6% and agriculture represents 6.8%.
These figures highlight the strategic importance of manufacturing and industrial production within the Chinese economy, which remains one of the world’s major manufacturing and supply chain hubs.
China’s industrial base spans a wide range of sectors, including electronics, automotive manufacturing, machinery, heavy industries, and energy.
At the same time, the growing contribution of services reflects the country’s economic transformation and the expansion of financial, commercial, and digital activities.
European Union: A Balance Between Industry and Services
With an estimated GDP of $22.52 trillion, the European Union represents another distinct economic model.
Services account for 73.3% of GDP, followed by industry at 25.1% and agriculture at 1.6%.
This distribution reflects an economy that combines a dominant services sector with a well-established industrial base.
Beyond financial services, tourism, and trade, the European economy maintains a strong industrial presence in automotive manufacturing, machinery, chemicals, pharmaceuticals, and industrial equipment.
Although the economic structure varies considerably across individual member states, services remain the largest contributor to the EU’s overall economic output.
India: Agriculture Retains a Larger Economic Share
India offers a contrasting picture, with an estimated GDP of $4.51 trillion.
Services contribute 54.7% of GDP, while industry accounts for 27.6% and agriculture represents 17.7%.
The relatively high share of agriculture highlights its continued importance within India’s economic structure, both in terms of production and its connection to the livelihoods of a significant portion of the population.
Meanwhile, services remain a major engine of economic activity, particularly in information technology, digital services, business process outsourcing, and financial services.
Industry also represents an important growth opportunity as India seeks to expand its manufacturing capabilities, attract investment, and strengthen its position in global supply chains.
What Does This Tell Us About the Future of the Global Economy?
The comparison demonstrates that the world’s major economies do not follow a single development model. Instead, each relies on a different combination of economic sectors shaped by its resources, level of development, and productive capabilities.
Three key observations emerge from the comparison:
1. Services dominate across all four economies
Despite differences in economic size and structure, services represent the largest sector in the United States, China, the European Union, and India. This highlights the growing importance of financial activities, technology, trade, and other service-based industries in generating economic output.
2. Industry remains a strategic source of global competitiveness
China’s industrial contribution of 36.5% and India’s 27.6% demonstrate the importance of productive capacity in supporting economic growth, strengthening competitiveness, and participating in international trade.
Industrial capabilities remain particularly important in an environment shaped by supply chain restructuring, technological competition, and growing concerns over economic security.
3. Agriculture reflects different stages of economic transformation
Agriculture contributes only 0.9% of GDP in the United States and 1.6% in the European Union, compared with 17.7% in India.
These differences reflect variations in economic structures, productivity levels, and the transition from agricultural activities toward industrial and service-based economies.
The Bottom Line
There is no single formula for building a strong economy.
The United States relies on a services-led model. China combines a substantial industrial base with an expanding services sector. The European Union maintains a balance between advanced industry and services, while agriculture continues to hold a more significant position in India’s economic structure.
Ultimately, the ability to generate higher value, improve productivity, strengthen innovation, and develop competitive industries remains central to long-term economic performance.
The question is no longer which sector is the largest, but how economies can transform their different sectors into sustainable sources of growth and global competitiveness.