Egypt’s exports to South Korea fluctuate significantly, while Korean exports to Egypt remain diversified across automotive, industrial, and technology-related products, highlighting opportunities to strengthen bilateral trade.
Egypt and South Korea maintain commercial ties spanning industrial goods, agricultural products, machinery, and manufactured materials. Their trade relationship reflects two different economic strengths: Egypt’s natural resources and selected agricultural and industrial exports, and South Korea’s globally competitive manufacturing and technology sectors.
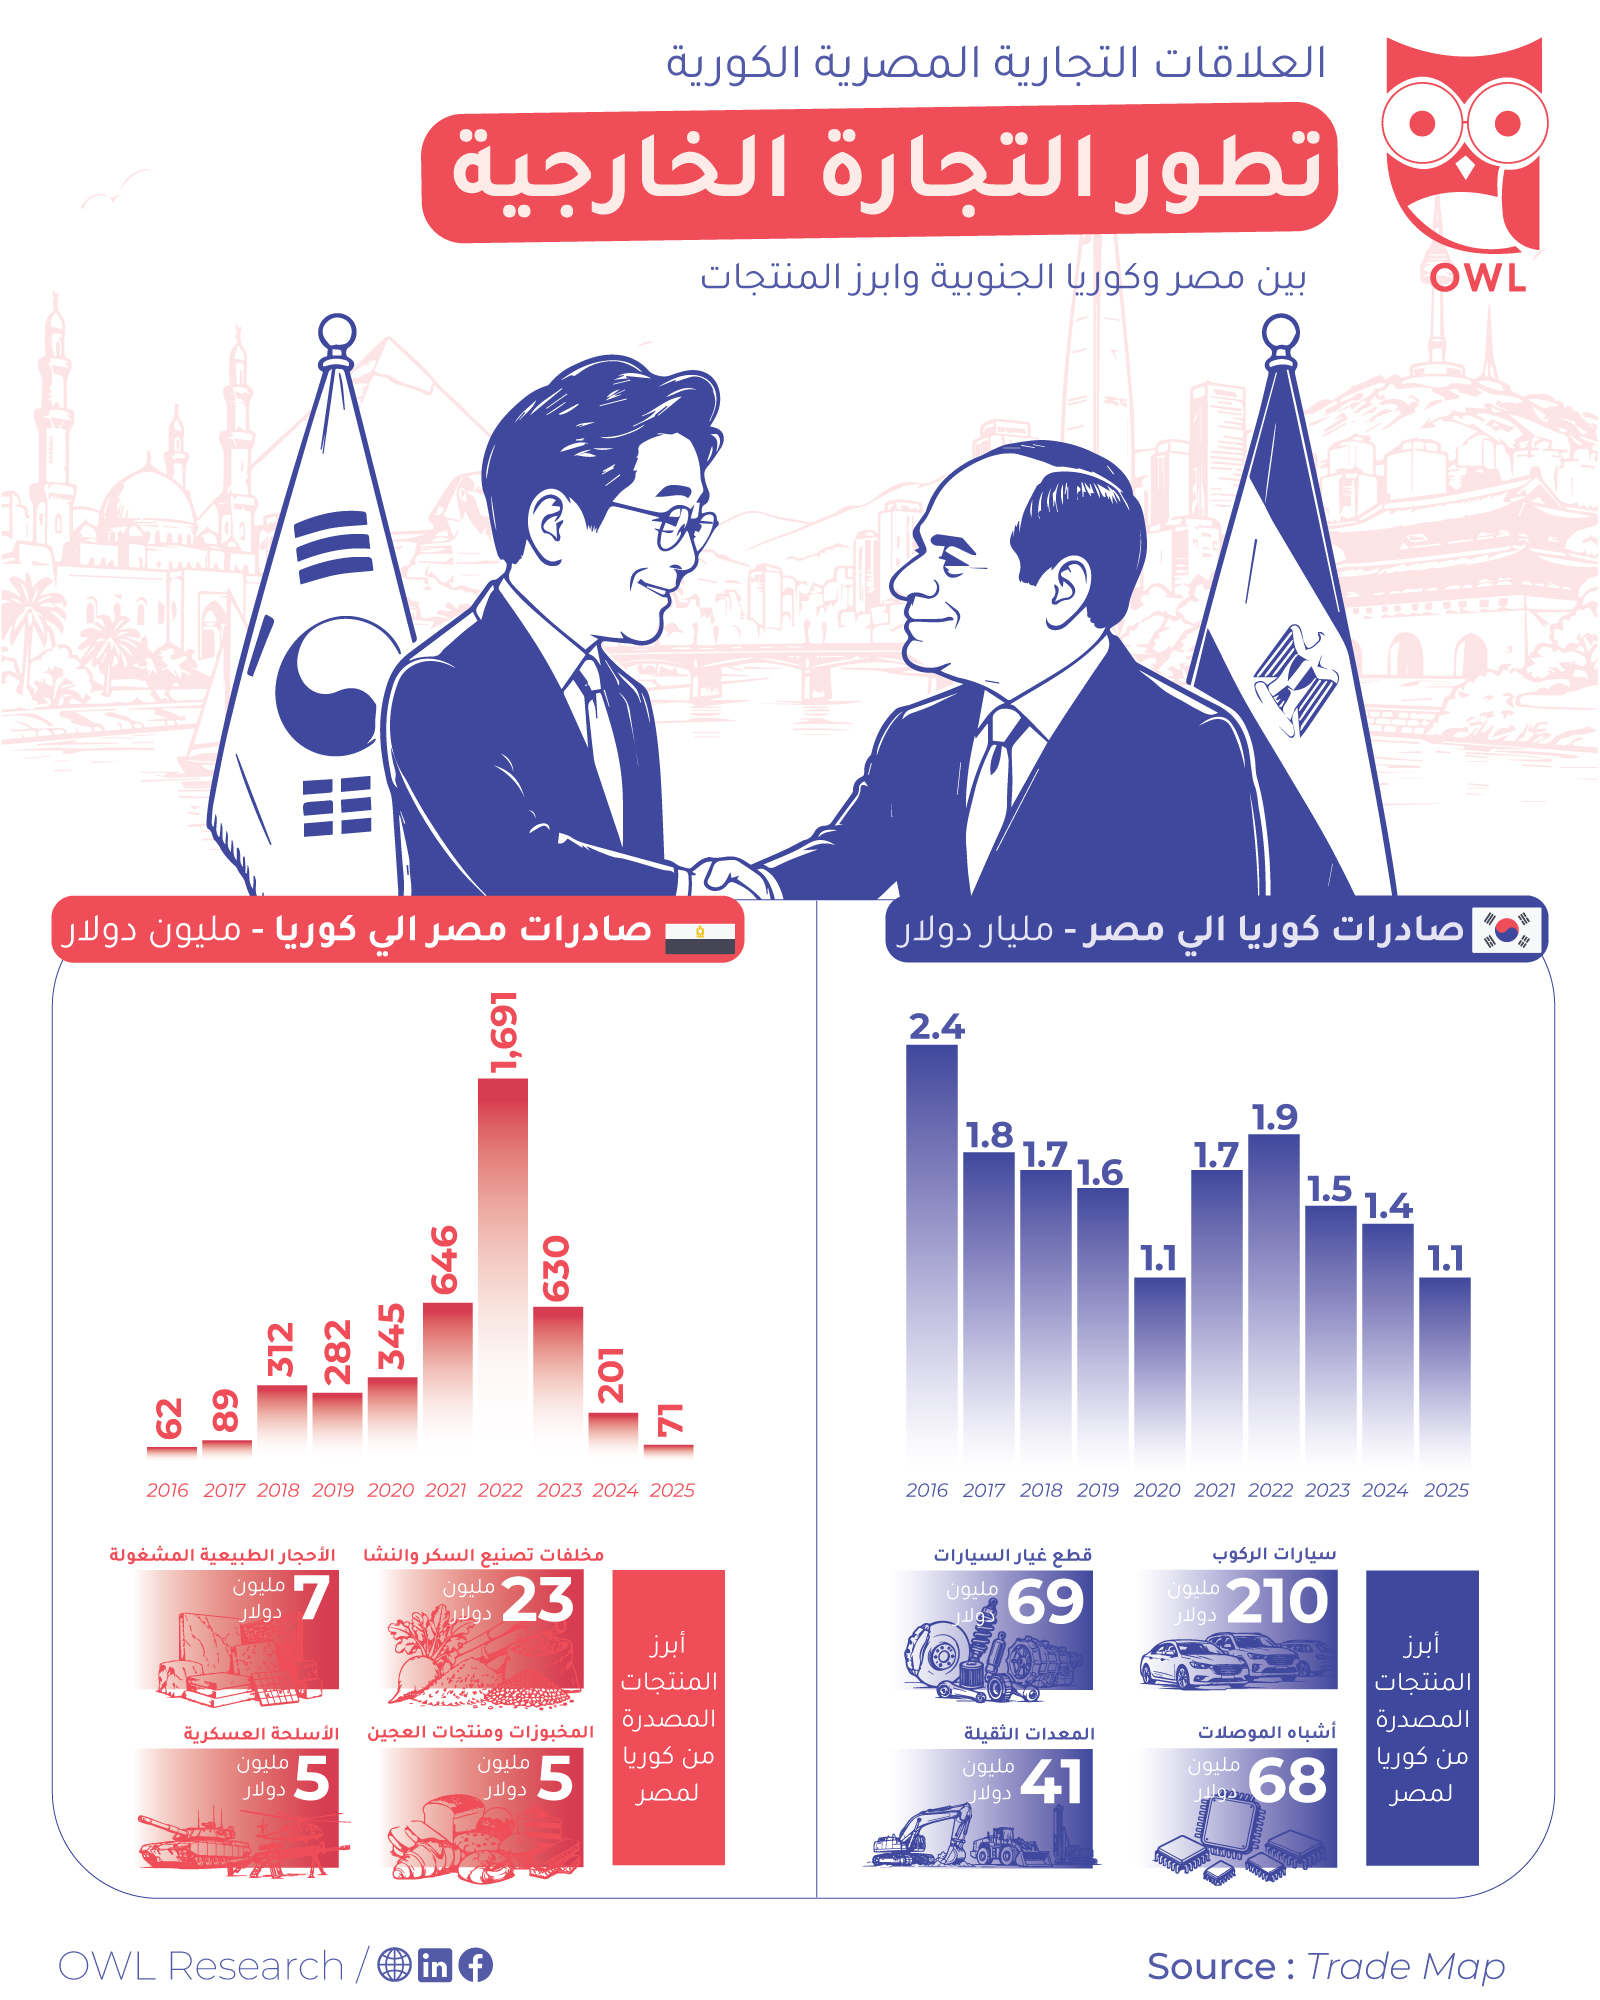
Trade Map data presented in the OWL Research infographic highlights how bilateral trade has evolved between 2016 and 2025, revealing contrasting export patterns and opportunities for deeper commercial cooperation.
Egypt’s Exports to South Korea: Significant Fluctuations
Egyptian exports to South Korea increased from approximately $62 million in 2016 to $89 million in 2017, before reaching $312 million in 2018.
Exports subsequently fluctuated, reaching $282 million in 2019 and $345 million in 2020. A sharp increase followed, with exports rising to $646 million in 2021 and peaking at approximately $1.69 billion in 2022.
However, the upward trajectory was not sustained. Egyptian exports declined to $630 million in 2023, fell further to $201 million in 2024, and reached approximately $71 million in 2025.
This pattern highlights the volatility of Egypt’s exports to South Korea. Rather than reflecting a consistent upward trend, the figures suggest that bilateral export values may be influenced by changes in individual product categories, commodity prices, or large transactions.
Understanding the underlying product-level movements is therefore essential to determining whether the decline represents a broader weakening in Egyptian export competitiveness or a normalization following an exceptional year.
What Does Egypt Export to South Korea?
The infographic highlights several Egyptian export categories, including:
- Sugar and confectionery manufacturing residues: Reported at approximately $23 million.
- Worked natural stone: Reported at approximately $7 million.
- Fertilizers and dough-related products: Reported at approximately $5 million.
- Military-related products: Reported at approximately $5 million.
These categories illustrate the range of products represented in the bilateral trade relationship. However, the values should be checked against the underlying Trade Map classifications before being interpreted as a complete ranking of Egypt’s exports.
Egypt could explore opportunities to expand its presence in selected product categories by strengthening compliance with Korean import requirements, improving product quality, and developing relationships with Korean distributors and industrial buyers.
South Korea’s Exports to Egypt: A Broader Industrial Footprint
South Korean exports to Egypt demonstrate a different pattern, with annual values remaining substantially higher than Egypt’s exports in most of the years shown.
Exports increased from approximately $2.4 billion in 2016 to $1.8 billion in 2017, followed by $1.7 billion in 2018 and $1.6 billion in 2019.
In 2020, exports declined to $1.1 billion before recovering to $1.7 billion in 2021 and $1.9 billion in 2022.
The value subsequently decreased to $1.5 billion in 2023, $1.4 billion in 2024, and approximately $1.1 billion in 2025.
The figures suggest that South Korea remains an important supplier of manufactured goods to the Egyptian market, even as annual trade values fluctuate.
Korea’s strengths in automotive manufacturing, electronics, machinery, and industrial equipment provide a foundation for continued commercial engagement with Egyptian importers and businesses.
Key South Korean Export Categories to Egypt
The infographic identifies four prominent Korean export categories:
- Passenger vehicles: Approximately $210 million.
- Electrical and electronic components: Approximately $68 million.
- Non-automotive spare parts: Approximately $69 million.
- Heavy equipment: Approximately $41 million.
These categories point to opportunities across Egypt’s automotive market, industrial operations, and technology-related supply chains.
For Egyptian businesses, Korean suppliers can represent potential partners for sourcing specialized equipment, components, and manufactured goods. For Korean companies, Egypt offers access to a large domestic consumer market and a strategic location connecting Africa, the Middle East, and Europe.
The reported category values should be interpreted according to their underlying product definitions and reference periods, as the infographic does not establish that every category represents a complete or mutually exclusive trade classification.
The Trade Imbalance: A Structural Difference Between the Two Economies
The figures illustrate a substantial difference between the value of exports moving in each direction.
South Korean exports to Egypt exceeded Egyptian exports to South Korea throughout most of the period presented. This reflects, in part, differences in industrial structure and the types of goods each economy produces for international markets.
South Korea has a strong manufacturing base that supports exports of vehicles, machinery, electronics, and other industrial products. Egypt, meanwhile, exports a different mix of products, including selected commodities, agricultural and industrial materials, and manufactured goods.
However, a bilateral trade deficit does not automatically indicate an unfavorable commercial relationship. Imported machinery, components, and industrial equipment can support domestic production, investment, and productivity.
The more important question is whether Egypt can expand its export capacity, increase the value added of its products, and develop stronger links with Korean businesses.
Where Are the Opportunities for Growth?
Several areas could support deeper trade relations between Egypt and South Korea.
1. Expanding Egyptian exports
Egyptian exporters could investigate opportunities in agricultural products, processed foods, fertilizers, industrial materials, and other categories where local producers can meet Korean quality and regulatory requirements.
2. Strengthening industrial cooperation
Partnerships between Egyptian manufacturers and Korean companies could support technology transfer, industrial investment, local production, and the development of specialized supply chains.
3. Supporting automotive and component supply chains
Korean automotive and industrial companies could explore opportunities to serve Egypt’s domestic market while assessing the potential for local sourcing and regional distribution.
4. Building long-term commercial partnerships
Trade promotion, buyer–supplier engagement, and a stronger understanding of market requirements could help Egyptian exporters identify sustainable opportunities rather than relying on a small number of high-value transactions.
Outlook: From Bilateral Trade to Strategic Economic Cooperation
Egypt–South Korea trade relations present a combination of established commercial flows and opportunities for further development.
The figures for 2016–2025 highlight the volatility of Egypt’s exports, particularly the exceptional peak in 2022, while Korean exports to Egypt remain concentrated in a broader range of manufactured and industrial products.
For Egypt, the priority is to understand the drivers behind export fluctuations and identify product categories capable of generating sustained demand. For South Korea, Egypt represents a potential market for industrial products and a platform for broader regional commercial engagement.
The strategic opportunity lies in transforming bilateral trade from a relationship dominated by manufactured imports into a more diversified partnership that supports exports, investment, and industrial cooperation.