The United States dominates global stock market capitalization at $79.47 trillion, while Asian financial markets continue to strengthen their position in the global investment landscape.
Global equity markets remain a critical pillar of the international financial system, reflecting economic strength, investor confidence, corporate performance, and capital allocation trends.
According to figures presented in OWL Research’s 2026 global stock market overview, the United States maintains a substantial lead in global equity market capitalization, followed by China, Japan, and Hong Kong.
The data highlights significant differences in market size relative to national economic output, offering insights into the structure and development of the world’s leading financial markets.
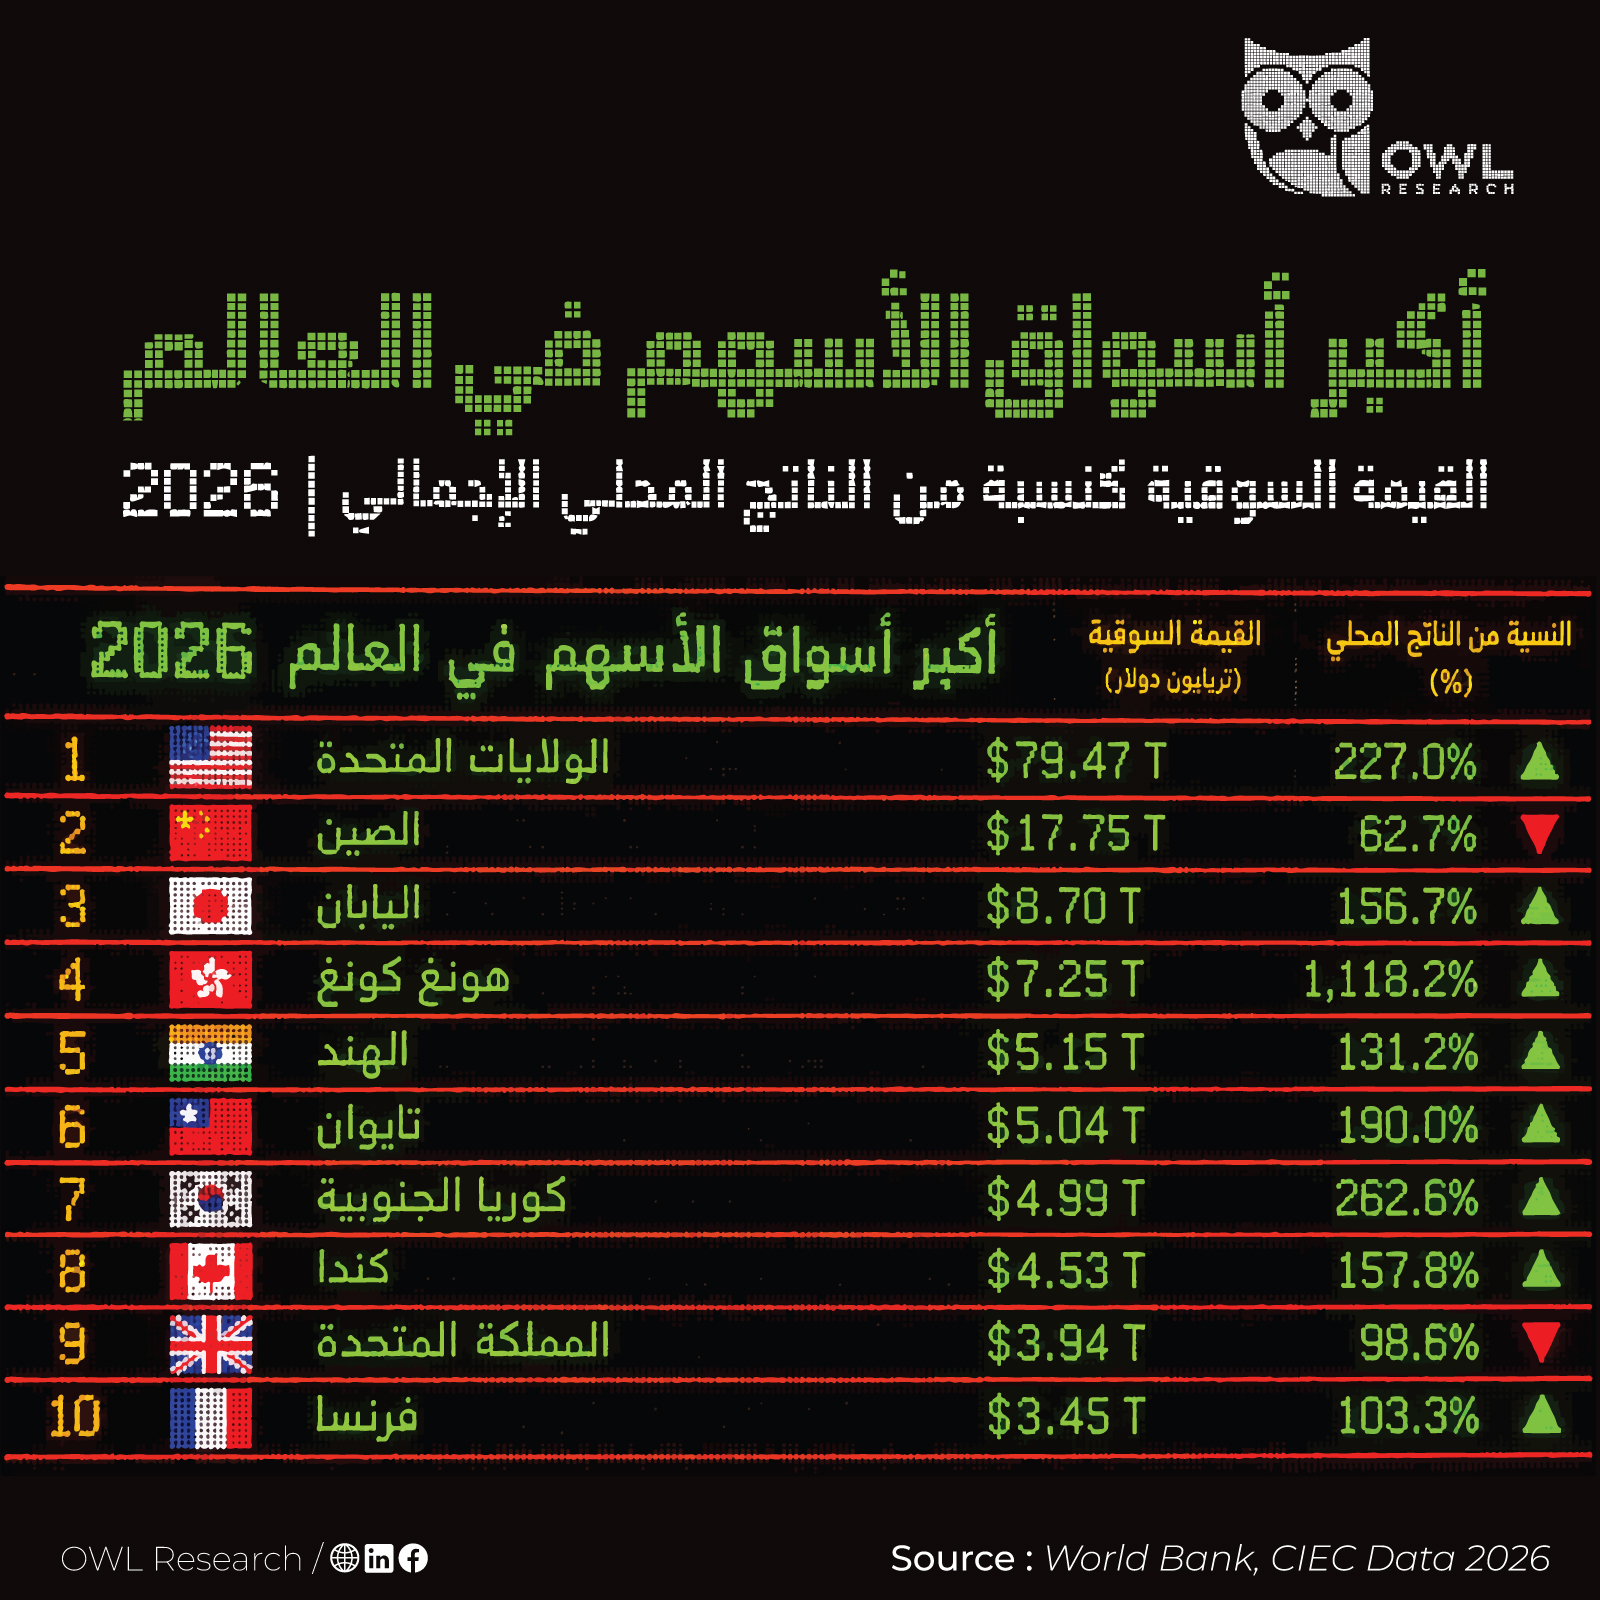
The United States Dominates Global Stock Market Capitalization
The United States remains the world’s largest equity market, with a reported market capitalization of $79.47 trillion, significantly exceeding that of any other country.
Its stock market capitalization represents approximately 227% of GDP, highlighting the scale of publicly listed companies relative to the American economy.
The dominance of US equity markets is supported by several structural factors, including the presence of major multinational corporations, highly developed capital markets, strong institutional investor participation, and a global concentration of technology and innovation-driven businesses.
The United States also benefits from the international importance of the US dollar and the global reach of its financial institutions.
China and Japan Lead Asia’s Major Equity Markets
China ranks second globally, with stock market capitalization reaching approximately $17.75 trillion, equivalent to 62.7% of GDP.
Despite its substantial market size, China’s capitalization-to-GDP ratio remains considerably lower than that of the United States, reflecting differences in financial market structures, corporate financing models, and the relative importance of publicly listed equities.
Japan follows in third position, with a market capitalization of $8.70 trillion, representing 156.7% of GDP.
Japan’s equity market continues to play an important role in global investment portfolios, supported by established multinational corporations across automotive manufacturing, electronics, industrial technology, and financial services.
Together, China and Japan demonstrate Asia’s significant presence within the global equity market landscape.
Hong Kong Stands Out for Its Market Capitalization Relative to GDP
Hong Kong ranks fourth, with a reported stock market capitalization of $7.25 trillion.
However, its most distinctive characteristic is the relationship between equity market capitalization and economic output.
At approximately 1,118.2% of GDP, Hong Kong records the highest capitalization-to-GDP ratio among the markets included in the ranking.
This exceptionally high ratio reflects Hong Kong’s role as an international financial center, where numerous listed companies conduct substantial business activities beyond the territory’s domestic economy.
As a result, stock market capitalization relative to GDP should not be interpreted as a direct measure of economic productivity or stock market valuation.
Instead, it provides an indication of the scale of listed equity markets compared with the size of the domestic economy.
India, Taiwan, and South Korea Strengthen Asia’s Financial Presence
India ranks fifth globally, with stock market capitalization reaching $5.15 trillion, equivalent to 131.2% of GDP.
India’s position reflects the growing scale of its publicly listed corporate sector and the importance of equity financing within its expanding financial system.
Taiwan follows closely with $5.04 trillion, representing 190% of GDP, supported by its globally significant semiconductor and technology industries.
South Korea ranks seventh, with a market capitalization of $4.99 trillion, equivalent to 262.6% of GDP.
The prominence of these three markets illustrates the importance of Asia’s technology, manufacturing, and industrial sectors within international capital markets.
Their combined presence also demonstrates the geographical diversification of global equity investment opportunities.
Canada and Europe’s Leading Markets Complete the Top Ten
Canada ranks eighth globally, with stock market capitalization of approximately $4.53 trillion, representing 157.8% of GDP.
The United Kingdom follows in ninth position with $3.94 trillion, equivalent to 98.6% of GDP.
France completes the top ten with a market capitalization of $3.45 trillion, representing 103.3% of GDP.
These markets remain important international investment destinations, supported by established financial institutions, multinational corporations, and developed regulatory frameworks.
However, their market capitalization figures also highlight the growing relative scale of major Asian equity markets within the global financial landscape.
Global Stock Market Capitalization: Top 10 Markets in 2026
| Rank | Market | Market Cap (USD Trillion) | Market Cap / GDP |
|---|---|---|---|
| 1 | United States | $79.47T | 227.0% |
| 2 | China | $17.75T | 62.7% |
| 3 | Japan | $8.70T | 156.7% |
| 4 | Hong Kong | $7.25T | 1,118.2% |
| 5 | India | $5.15T | 131.2% |
| 6 | Taiwan | $5.04T | 190.0% |
| 7 | South Korea | $4.99T | 262.6% |
| 8 | Canada | $4.53T | 157.8% |
| 9 | United Kingdom | $3.94T | 98.6% |
| 10 | France | $3.45T | 103.3% |
What Do These Figures Reveal About Global Financial Markets?
The ranking highlights four important structural characteristics of international equity markets.
1. US market concentration remains substantial
The United States maintains a considerable lead over other equity markets, reflecting its concentration of large publicly traded corporations and its central role in international investment flows.
2. Asia represents a major center of equity market activity
Six of the ten markets in the ranking are located in Asia, including Hong Kong and Taiwan. This underscores the region’s growing importance in global financial markets.
3. Market capitalization and GDP measure different dimensions
Stock market capitalization measures the combined market value of listed companies, while GDP measures the value of economic production within a defined period.
A high capitalization-to-GDP ratio does not necessarily indicate stronger economic performance or overvalued equities. Differences in corporate listings, international operations, and market structures must also be considered.
4. Financial market development varies across economies
Differences in equity market capitalization relative to GDP highlight the diversity of national financial systems, including the varying roles of public equity, private ownership, and bank financing.
The Outlook: A More Diversified Global Equity Landscape
The global equity market landscape continues to be characterized by substantial US leadership alongside the significant presence of Asian financial markets.
While the United States remains the dominant center of listed equity value, markets such as China, Japan, India, Taiwan, and South Korea represent important components of the international investment ecosystem.
For investors, policymakers, and businesses, understanding these structural differences is essential when assessing capital market development, international investment opportunities, and long-term economic competitiveness.
As global capital markets evolve, the relationship between market capitalization, economic output, and corporate performance will remain an important area of analysis.